|
Understanding the Timeline of Demand Response Evolution
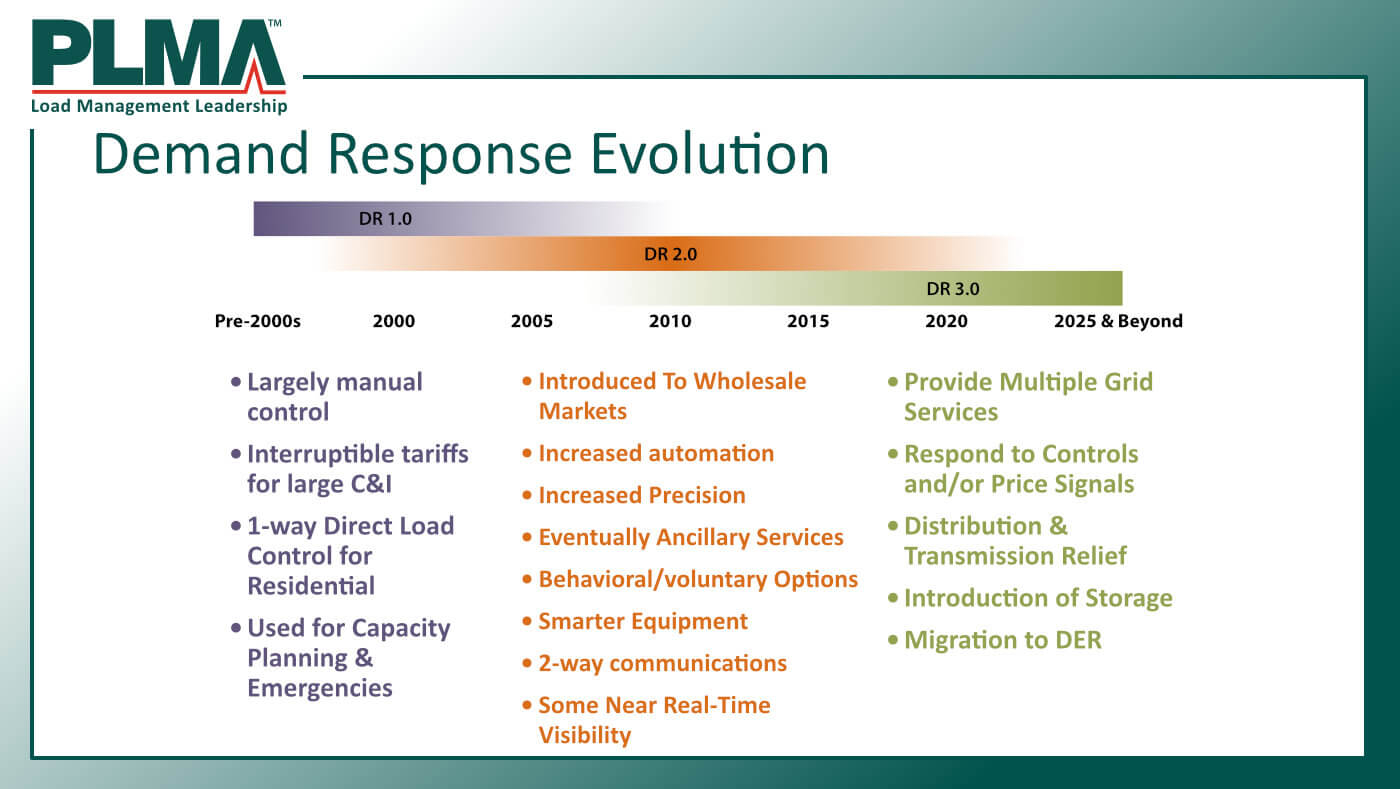
An Overview of DR 1.0 to DR 2.0 to DR 3.0

As PLMA developed materials for the four classes in its Demand Response Training Series, the PLMA Education Committee and Training Partners recognized there was not a single, agreed-upon definition of demand response and the stages of its evolution (DR 1.0, 2.0, and 3.0). To help new and transitioning professionals, regulators, and lawmakers understand the growth and trends happening in demand response, in 2016, PLMA developed a harmonized, consistent definition, and followed it with a public comment period. This PLMA definition is used in all of PLMA's classes.
The opening session of the 48th PLMA Conference titled, "What Will DR 4.0 Look Like?" will explore the continued evolution of demand response. For more information on this session, and to access the 48th PLMA Conference agenda, please click here.
Demand Response Evolution in Three Stages
Demand Response 1.0 - The Past
The beginning of demand response can be traced to the first interruptible tariffs:
- For large commercial and industrial customers when utility staff called or paged a primary customer contact to request they manually change their power consumption on-site with no immediate feedback in the utility control room, or
- For residential customers when the first one-way communication load-control devices were installed on residential water heaters and air conditioners, or
- When wholesale markets were introduced to the U.S. electricity industry.
Then, demand response was primarily used to provide energy (MWh) and/or capacity (MW) when wholesale prices were unusually high, when there was a shortfall in generation or transmission capacity, or during unexpected emergency grid operating situations. Notifications were typically manual "day-ahead" or "hour(s)-ahead" and the "system of record" for measurement and verification was usually the utility meter which was read on its regular cycle, often manually. There was little or no immediate customer feedback on performance during these early demand response events.
Demand Response 2.0 - The Present
Demand response has become integral to most wholesale electricity markets and grid operation systems in the U.S. Demand response-driven initiatives provide more precise energy and capacity to support wholesale marketplace activities, as well as more sophisticated and near-instantaneous Ancillary Services, such as non-spinning and spinning reserves and frequency and voltage support.
DR measurement and verification has become much more sophisticated and near real-time measurements (either utility or non-utility) are often used as the "system of record" for confirmation of customer performance during demand response events, and for customer feedback.
DR 3.0 - The Current Path to the Future
Demand response is evolving to be a component of broader distributed energy resources including distributed photovoltaic, electric vehicle charging, and various forms of energy/thermal storage, both on a grid operating system scale as well as behind-the-meter (i.e., on the customer side of the meter).
As a component of distributed energy resources, demand response can now provide a variety of service benefits both to the grid operator and to the customer. Customers may even be "prosumers" who both provide and consume grid power including volt/var control, renewable energy integration, and localized distribution system congestion management.
Where wholesale markets exist, the major underlying economic principle of demand response is a price signal, which moves the industry away from traditional "command-and-control" mechanisms to manage grid operations. DR 3.0 is not triggered directly by the utility or by the system operator; instead it happens automatically via devices that react to pre-programmed price thresholds, although prices do not always trigger a DR signal. Utilities can also rely on a grid signal such as voltage, rather than a price signal, for emergencies and system peaks.
|